 Live Greyhound Betting
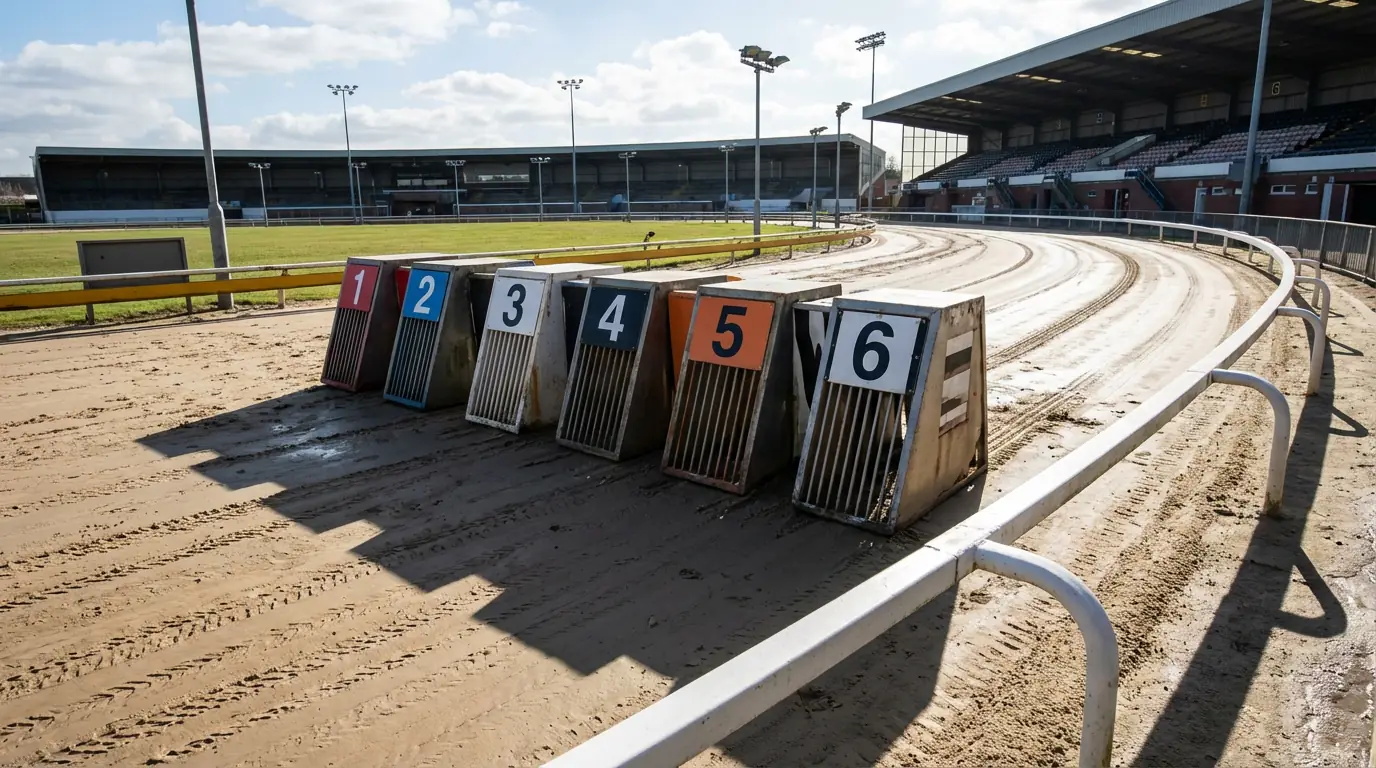
Best Greyhound Betting Sites – Bet on Greyhounds in 2026
Loading...
The Number on the Jacket Is Not Random
The number on the jacket tells you where a greyhound starts — and in a sport decided by fractions of a second over four hundred metres of sand, where a dog starts can matter as much as how fast it runs. Trap draw is the assignment of each dog to a specific starting position, numbered one through six from the inside rail outward. It is not allocated randomly. The racing manager seeds traps based on a dog’s known running style, but the relationship between trap number and race outcome is one of the most consistent statistical patterns in greyhound racing.
For bettors, trap draw analysis is one of the few areas where hard data can be applied directly to decision-making. Every UK track publishes results that can be broken down by trap, and those numbers reveal persistent biases that shift your assessment of a race before you even look at form. Ignoring trap draw is like studying a football team’s goal-scoring record without checking who they are playing. The information is available, it is relevant, and it costs nothing to use.
This guide explains why trap draw matters, how inside and outside positions create different advantages and disadvantages, and how to find and interpret track-specific trap bias data for smarter greyhound betting.
Why Trap Draw Matters
Greyhound racing is a sprint around an oval track with four bends. The geometry of that oval means the inside rail is the shortest route. A dog running on the rail covers less ground than one running wide, and over a standard four-bend race, the difference can amount to several lengths. That basic geometric fact is the root cause of trap bias.
But geometry alone does not explain the full picture. Trap draw also determines where a greyhound is positioned relative to its competitors in the critical first few seconds after the traps open. The run from the boxes to the first bend is typically between forty and eighty metres, depending on the track. In that short distance, six dogs accelerate to top speed and begin jostling for position. A dog in trap 1 has immediate access to the rail. A dog in trap 6 must either cross the field to reach the rail or commit to running wide through the first two bends.
The consequences cascade from there. A front-runner drawn in trap 1 on a tight track can hug the rail and lead from start to finish without interference. The same dog drawn in trap 5 might need to burn extra energy cutting across to the rail, potentially causing crowding that disrupts the entire field. A closer drawn in trap 6 might benefit from staying wide and having a clear run through the final bends while the inside dogs are bunched together.
Trap draw interacts with running style, track configuration, and the composition of the field. That interaction is what makes it analytically valuable. A dog’s form figures might look excellent, but if those results came from favourable draws and the dog is now facing a less advantageous position, the form needs to be discounted. Conversely, a dog with moderate form from poor draws might be significantly better than its record suggests when it finally gets a favourable trap.
Inside Traps vs Outside Traps
Across UK greyhound racing as a whole, inside traps — particularly traps 1 and 2 — produce more winners than outside traps. The margin is not enormous, but it is statistically significant and remarkably consistent over large sample sizes. Trap 1 typically wins around 18–20% of races nationally, while trap 6 wins around 13–15%. On a perfectly level playing field with no trap advantage, each trap would win approximately 16.7% of the time.
That inside-trap advantage stems from two factors working together. First, the shorter distance around the bends. Second, the seeding system: racing managers tend to assign trap 1 to dogs that prefer to run on the rail, which means the dog in trap 1 is not only closest to the rail but is often the dog most comfortable and effective running there. The seeding amplifies the geometric advantage.
Outside traps are not without their merits. Trap 6 — and to a lesser extent trap 5 — can suit dogs that prefer a clear run. A wide-running dog in trap 6 avoids the crowding that often occurs on the inside through the first bend. If the inside dogs bump and check each other, the wide runner can maintain momentum and arrive at the second bend in a strong position. On larger tracks with more gradual bends, the disadvantage of running wide is reduced, and outside traps become more competitive.
The middle traps — 3 and 4 — are the most neutral positions. They do not offer the rail advantage of trap 1 or the clear-air benefit of trap 6. Dogs drawn in the middle need either strong early pace to secure a position before the first bend or enough tactical speed to navigate through traffic. Middle traps tend to produce winners at rates close to the expected average, but with higher variance — they are more dependent on the specifics of the race than the inherent properties of the draw.
One important nuance: trap bias is not fixed. It shifts with track conditions. After heavy rain, the inside of the track can become slower if drainage is uneven, temporarily reducing the advantage of low traps. Wind direction can also play a role on tracks where one straight is more exposed than the other. These variables mean that blanket rules about inside traps always winning are an oversimplification. The data gives you a baseline; the conditions on the day refine it.
Track-Specific Trap Bias Data
National averages are useful as a starting point, but the real analytical edge comes from track-specific data. Every UK greyhound track has its own trap bias profile, shaped by its unique geometry, circumference, bend tightness, and run-up distance to the first bend. A track where trap 1 wins 22% of races is a fundamentally different betting environment from one where trap 1 wins 16%.
Tight tracks with short runs to the first bend tend to amplify inside-trap bias. At these venues, dogs in traps 1 and 2 reach the rail before outside runners can cross in, and the compactness of the bends penalises wide running more heavily. If you are betting regularly at a track with a circumference under 400 metres and a short first-bend run-up, weighting your selections toward inside draws is a data-supported approach.
Larger tracks with longer straights and more sweeping bends reduce the inside advantage. At these venues, outside runners have more time and space to find their position, and the distance lost on the bends is less punishing. Trap bias at larger tracks tends to be flatter — the difference between the best and worst traps is smaller, and the advantage shifts more toward running style and raw speed than positional draw.
To access track-specific trap statistics, the Greyhound Board of Great Britain publishes results through its official channels. Several dedicated greyhound data sites also aggregate trap win percentages by track, often broken down by distance as well. A dog’s trap record at a specific track is even more valuable than the overall track bias, because it tells you whether that particular animal has demonstrated an ability to win from its drawn position at that venue.
When using trap data, sample size matters. A trap bias calculated from fifty races is less reliable than one from five hundred. Look for data covering at least three to six months of racing at a given track before treating the numbers as meaningful. Short-term streaks can distort the picture — trap 1 might win ten of fifteen races in a week due to the specific dogs drawn there, not because of any underlying track advantage. The longer the sample, the more the noise washes out and the genuine structural bias emerges.
Combine trap data with form analysis for the strongest results. If trap 1 wins 21% of races at a track and the dog drawn there has strong recent form, that convergence of positional and form-based evidence is more powerful than either factor alone. If trap 1 has a strong historical record but the dog drawn there has poor form, the trap bias alone is unlikely to overcome genuine lack of ability. Data informs the bet; it does not make it for you.
The Draw Before the Race
Trap draw is the first piece of information available on any greyhound race card, and it should be the first piece you process. Before form figures, before sectional times, before trainer records — look at where each dog is drawn and ask what that position means at this track, over this distance, in these conditions.
The analysis does not need to be complex. Know the track’s trap bias from the data. Know each dog’s preferred running style and whether the draw supports or hinders it. A front-running railer in trap 1 on a tight track with a strong inside bias is a confluence of advantages. A wide runner in trap 1 on the same track might struggle to express its preferred style. The draw does not override form, but it provides a frame within which form makes more or less sense.
Over time, the punters who consistently account for trap draw in their analysis make better selections than those who treat all six traps as equivalent. The edge is not dramatic on any single race. But across a season of greyhound betting, understanding the draw — and refusing to ignore it — is one of the simplest, most data-driven improvements you can make.